How to Calculate and Interpret Key Financial Metrics
Corgage Team · · 1 min read
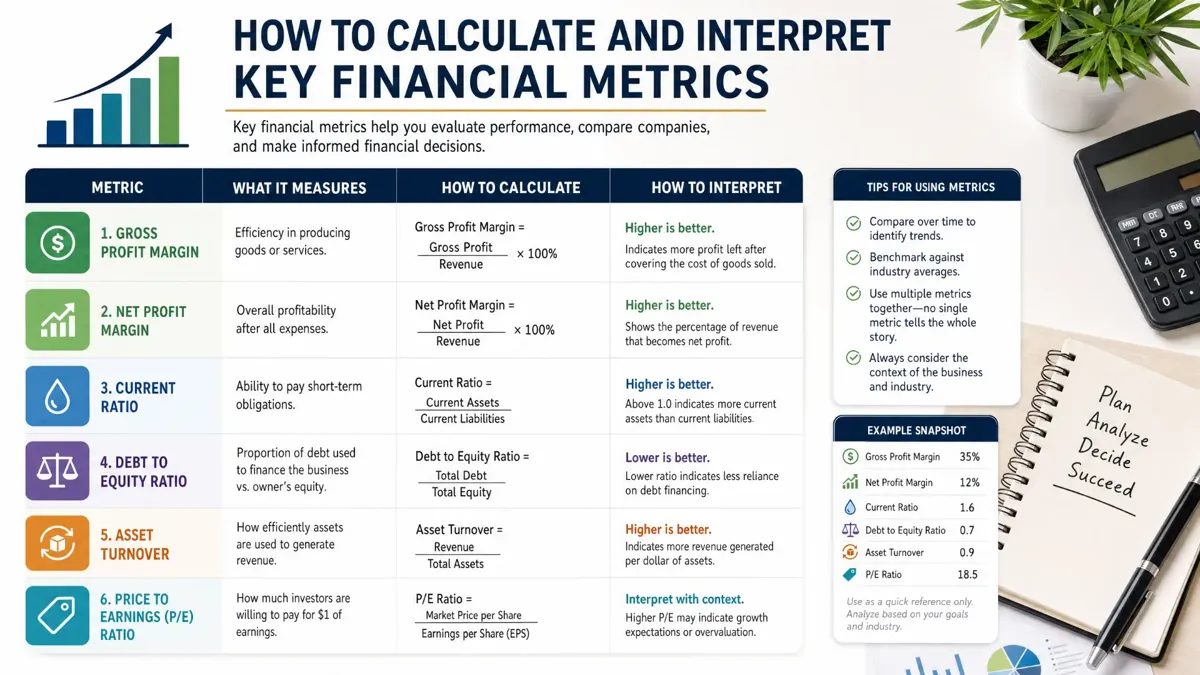
Financial metrics help assess a company's profitability, liquidity, efficiency, debt level, and market performance. Profitability ratios such as gross profit margin, operating margin, net profit margin, ROA, and ROE show how effectively the company generates profit from sales, assets, and shareholders' investment. Liquidity ratios, including the current ratio and quick ratio, measure the company's ability to meet short-term obligations. Solvency ratios such as debt-to-equity and interest coverage indicate the level of financial risk and the company's ability to manage debt. Efficiency metrics, including inventory turnover, receivables turnover, and the cash conversion cycle, show how well the company uses its resources and collects cash. These metrics should be compared with previous periods, industry averages, and competitors to understand whether performance is improving or weakening.
Corgage helps: analyze your own financial data, track key metrics over time, and see changes in clear charts and explanations. Use those insights to compare performance and make more informed decisions about where to focus next.
Financial Analysis
Run this analysis on your own data
Upload a CSV, Excel, or JSON file and Corgage profiles it, charts it and explains what changed. Start with free AI CSV analysis, see how Corgage works or compare plans and credits.
Start your free trialRelated data analysis guides
- What Skills Do You Need to Become a Market Research Analyst?
Strong analysis, communication, and curiosity — these are the skills that make a market research analyst effective. Here is the full list to build your career on.
- How to Break Into Market Research Without Experience
You can land a market research role without experience by building practical skills, creating portfolio projects, and applying with confidence. Here is a clear, step-by-step path in.
- How Much Do Market Research Analysts Make?
A clear look at what market research analysts earn — median pay, percentile ranges, and the factors that push salaries higher.