Which Data Analytics Tools Should I Learn First?
Corgage · September 25, 2026 · 1 min read
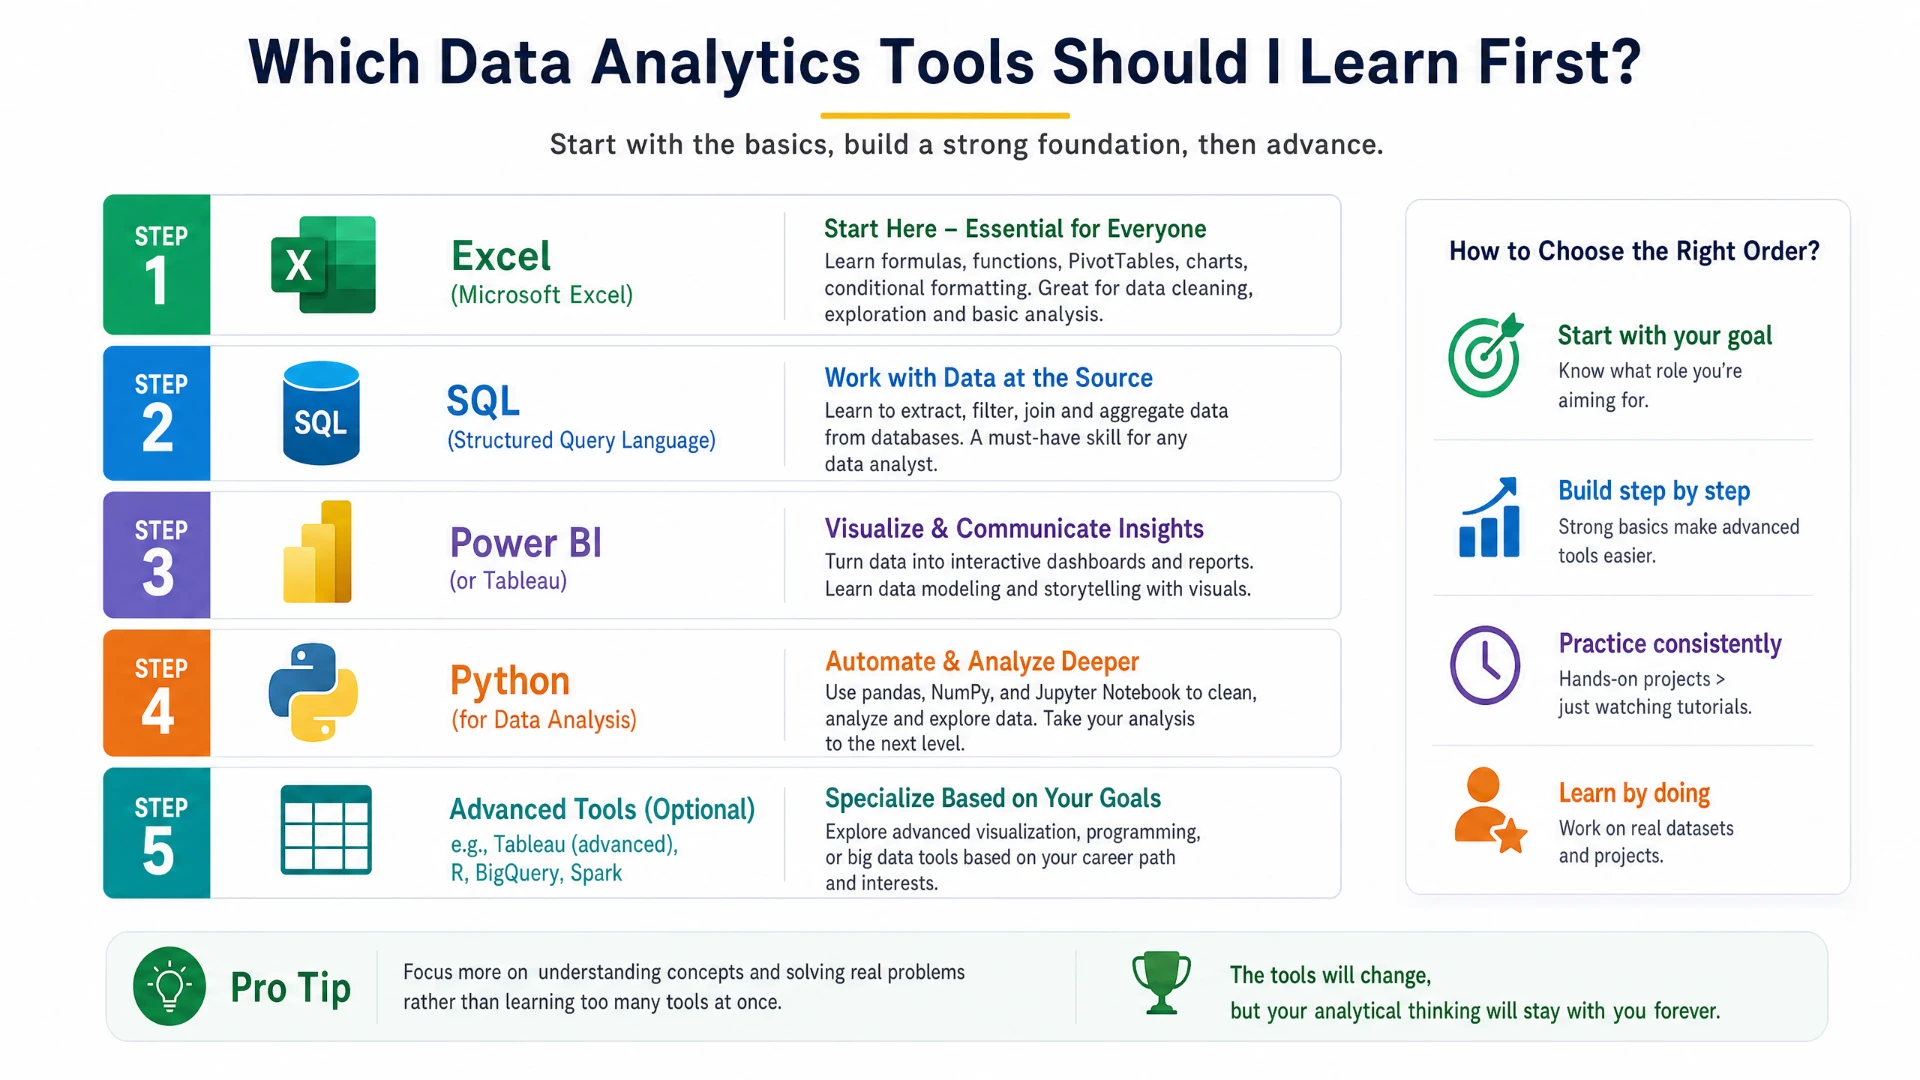
Start with Excel or Google Sheets to learn formulas, pivot tables, data cleaning, and basic charts.
Next, learn SQL, focusing on filtering, joins, grouping, subqueries, and window functions.
Then choose a visualization tool such as Power BI or Tableau to create dashboards and communicate insights.
After that, learn Python, especially pandas, NumPy, and basic data visualization.
Study statistics alongside these tools so you can interpret trends, correlations, and uncertainty correctly.
A strong beginner path is Excel → SQL → Power BI → Python → statistics, supported by a few practical portfolio projects.
With Corgage, you can put this path into practice immediately — upload your own CSV, Excel, or JSON files and get plain-English, evidence-backed answers with charts and forecasts. It is an easy way to keep learning on real data while each tool starts to click.
data analyticscareer guidesExcelSQLPower BIPython
Run this analysis on your own data
Upload a CSV, Excel, or JSON file and Corgage profiles it, charts it and explains what changed. Start with free AI CSV analysis, see how Corgage works or compare plans and credits.
Start your free trialRelated data analysis guides
- Is Data Analytics Still Worth Learning Right Now?
Yes — data analytics is still worth learning, but the field is changing. Here are the skills that matter most and how to stand out.
- Can AI Replace Data Analysts?
AI can automate repetitive analysis tasks, but it cannot replace the judgment, business context, and communication that skilled analysts bring. Here's a balanced look at what changes — and what doesn't.
- What Do Companies Look for When Hiring Data Analysts?
Companies hiring data analysts look for strong skills in SQL, Excel, data visualization, and basic statistics — plus communication, problem-solving, and a portfolio of real projects.